What the responses show
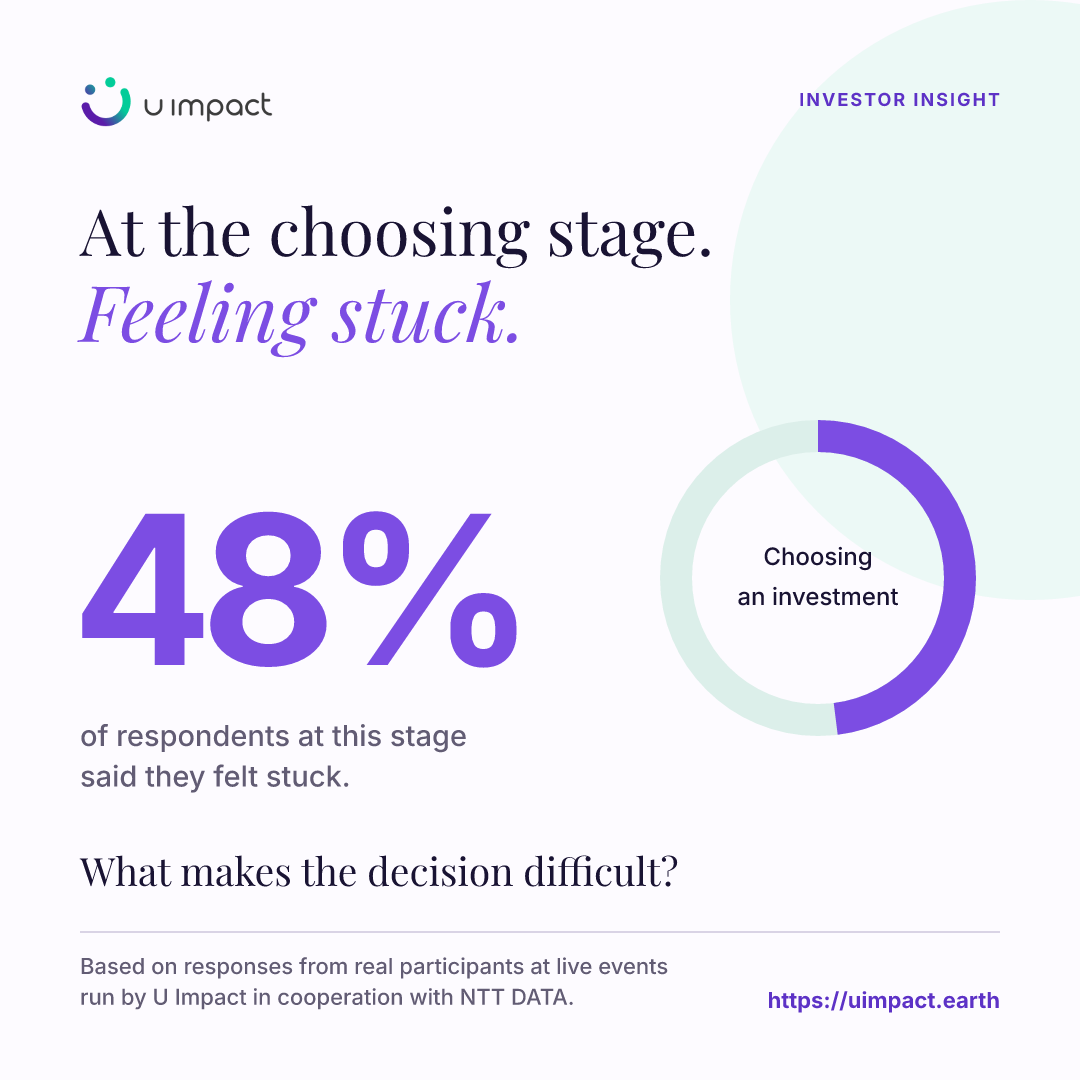
In our current analysis, 48% of participants at the “choosing what to invest in” stage reported feeling stuck.
Based on responses from real participants at live events run by U Impact in cooperation with NTT DATA.
Being at the choosing stage tells us where someone is in their investment journey. Asking whether they feel stuck adds a different insight: how they experience that decision.
For wealth managers and investment platforms, the practical question is what sits behind that feeling. Would a clearer explanation of the options help? Does the investor need to discuss uncertainty? Is the choice itself overwhelming? The percentage points to a question worth investigating; it does not establish the cause.
U Impact helps teams investigate these patterns in a defined customer group and turn the findings into support options worth testing, from clearer guidance to a more useful next step in the investor journey.
Investigate the decision, not just the screen
Start with the choice customers are trying to make. A selection page can be easy to navigate while the investment decision still feels difficult. Ask customers to explain what they are comparing, what remains unclear and what would help them decide whether to proceed.
The next research step should distinguish those explanations. If people cannot explain the differences between options, a clearer comparison may be worth testing. If they understand the options but remain uncertain about committing, more descriptive copy may miss the question. These are candidate responses to investigate, not conclusions from the percentage.
Questions for your team
- Which investment decision is the customer trying to make?
- What do they mean when they say they feel stuck?
- What evidence would show that the proposed support is useful?
Evidence and interpretation
Based on responses from real participants at live events run by U Impact in cooperation with NTT DATA.
The percentage describes participants who selected the choosing stage and answered the question about how their investment journey felt. It is a share within that stage, not a share of all participants.
This analysis uses the combined completed responses in the Mirai app, reviewed on 30 September 2026. Percentages are rounded and use the relevant answered questions; responses without the required answers are excluded from that comparison. These are self-reports from an event audience, not a representative population estimate, observed investment transactions or evidence of cause and effect.
Read more about our methodology and financial investment behaviour: the field guide.
Put the question to work
Want to understand where your investors feel stuck? Tell us which customer group and decision you want to investigate. We can discuss a focused diagnostic.