What the responses show
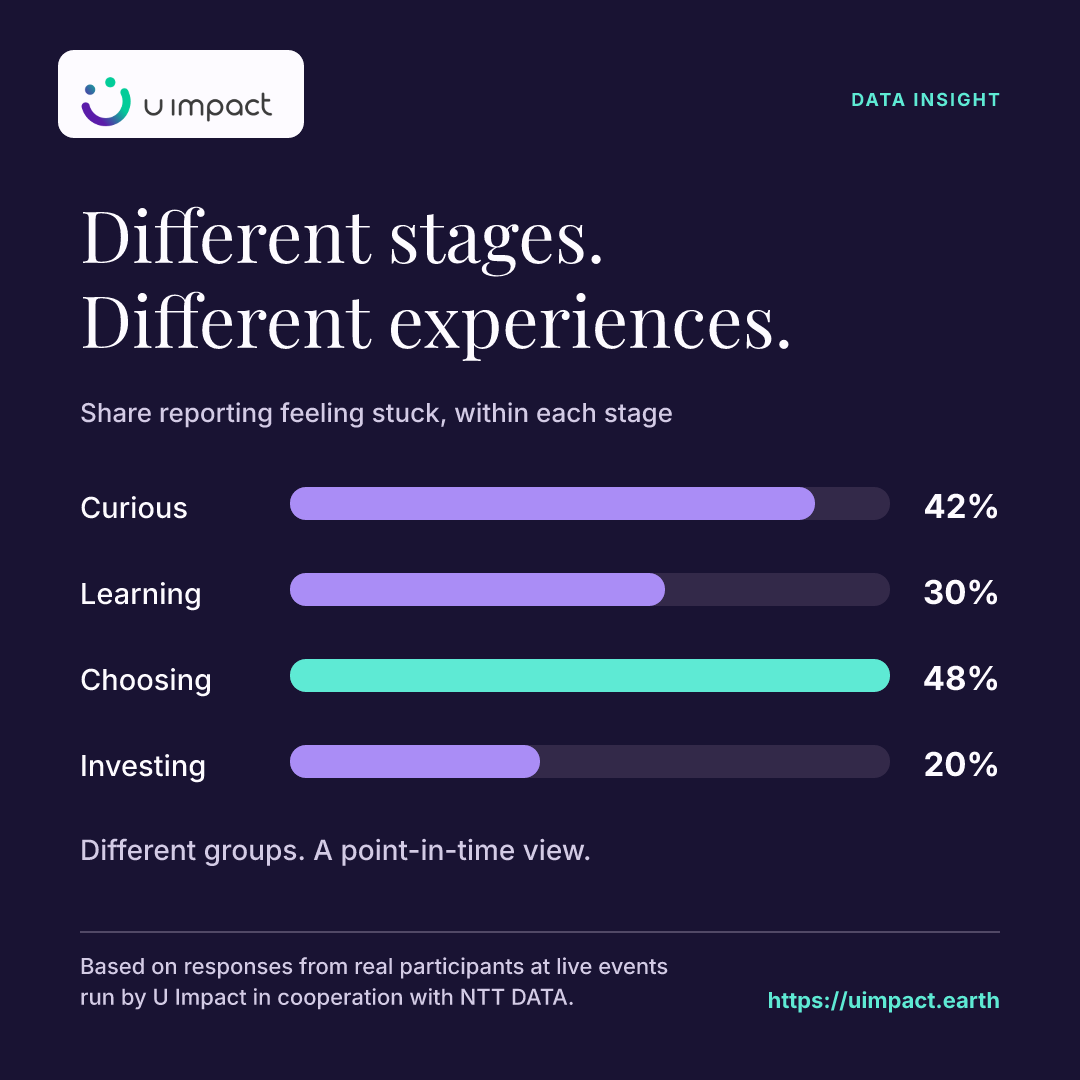
In our combined Mirai analysis, the share reporting feeling stuck was 42% among curious participants, 30% among those learning, 48% among those choosing an investment and 20% among those already investing.
Based on responses from real participants at live events run by U Impact in cooperation with NTT DATA.
These are different groups answering at a point in time. They do not show people moving through stages, a dropout rate or the effect of an intervention.
For customer-insight leaders, the practical use is to identify a stage worth investigating, then examine the decision and support needs within that group.
Choose the right next research step
A comparison across stages can help prioritise where to look more closely. It cannot establish that someone becomes less stuck by moving to another stage, because the groups are not the same people observed through time.
If a wealth team wants to understand change, it needs evidence designed for that question. Follow a defined group over time, record the relevant decision and examine what else changed. If the immediate goal is to understand a stage, a focused diagnostic within that group may be a more suitable next step.
Questions for your team
- Are you comparing different groups or following the same people?
- Is the goal to understand a stage or measure change over time?
- What further evidence would answer that question?
Evidence and interpretation
Based on responses from real participants at live events run by U Impact in cooperation with NTT DATA.
Each percentage uses participants in the named journey stage who answered the momentum question. The groups are observed at a point in time. The chart does not measure stage-to-stage conversion, dropout, progress or the effect of an intervention.
This analysis uses the combined completed responses in the Mirai app, reviewed on 30 September 2026. Percentages are rounded and use the relevant answered questions; responses without the required answers are excluded from that comparison. These are self-reports from an event audience, not a representative population estimate, observed investment transactions or evidence of cause and effect.
Read more about our methodology and financial investment behaviour: the field guide.
Put the question to work
U Impact helps wealth teams turn patterns into focused research questions and testable changes. Which stage of your customer journey needs a closer look?