What the responses show
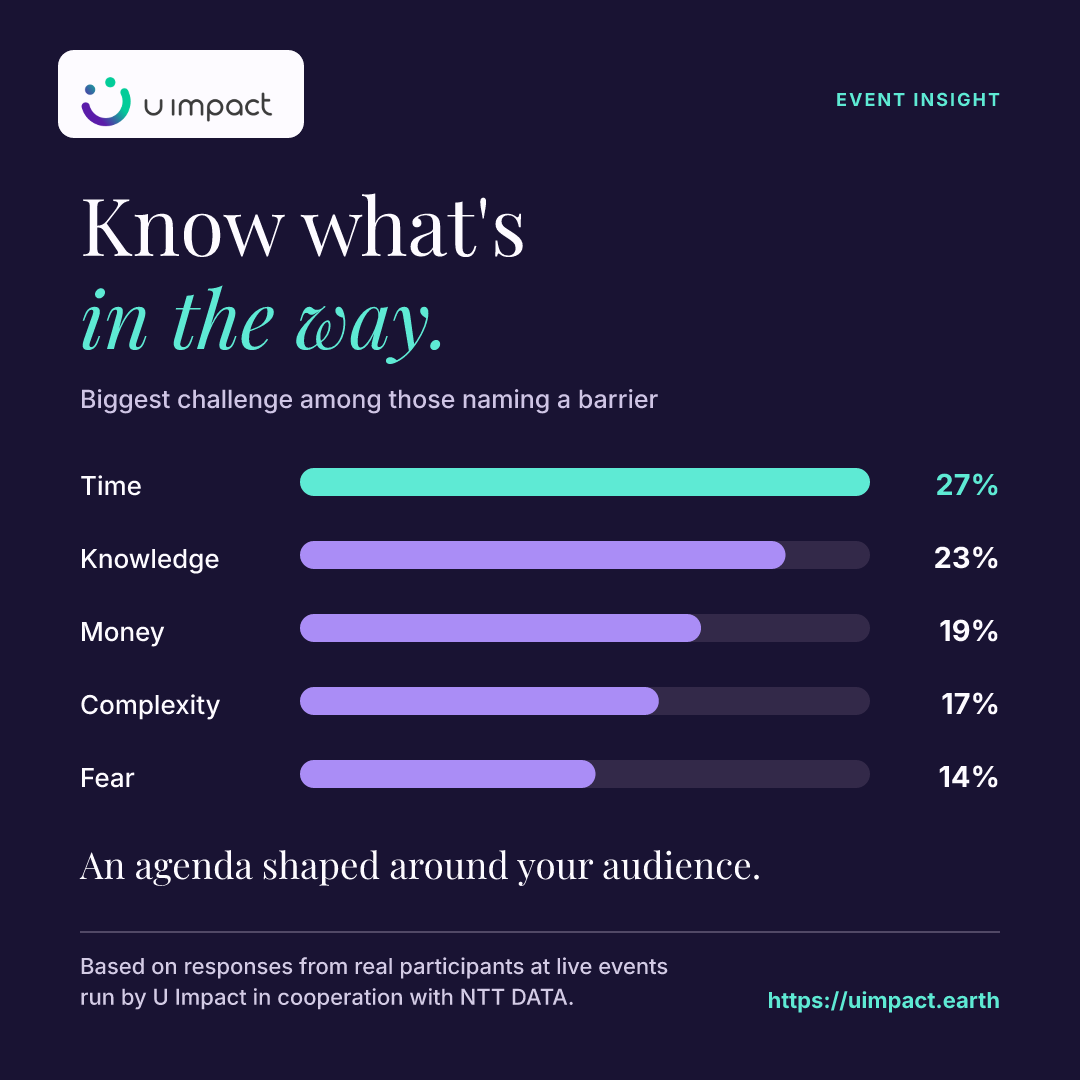
Among participants who named a barrier in our current analysis, time led at 27%, followed by knowledge at 23%, money at 19%, complexity at 17% and fear at 14%.
Based on responses from real participants at live events run by U Impact in cooperation with NTT DATA.
That spread suggests several useful conversations to explore. An educational session might address a knowledge question; a discussion about complexity could focus on how choices are explained. Each is a hypothesis to explore with the audience.
For client events, investor days and financial-wellbeing programmes, U Impact combines a branded assessment, private participant results and a facilitated discussion of aggregate patterns. Organisers leave with a readout that can inform future sessions and follow-up.
Use the pattern to open a conversation
An organiser can use these themes to prepare relevant prompts before a discussion. Ask speakers how they would respond to someone who names time, knowledge or complexity as their obstacle. Keep room for the audience to explain what those labels mean in practice.
The combined event results are a starting point for planning, not a prediction of the next room. A fresh audience assessment can reveal whether similar themes arise in that audience. The facilitator can then connect the discussion to the session purpose without assuming that one answer describes everyone.
Questions for your team
- What decision brings this audience together?
- Which themes should the facilitator be ready to explore?
- How will the organiser use the aggregate readout afterwards?
Evidence and interpretation
Based on responses from real participants at live events run by U Impact in cooperation with NTT DATA.
The percentages describe participants who named a barrier. They are not restricted to participants who felt stuck. Barrier categories describe selected answers, not a diagnosis of the underlying cause.
This analysis uses the combined completed responses in the Mirai app, reviewed on 30 September 2026. Percentages are rounded and use the relevant answered questions; responses without the required answers are excluded from that comparison. These are self-reports from an event audience, not a representative population estimate, observed investment transactions or evidence of cause and effect.
Read more about our methodology and financial investment behaviour: the field guide.
Put the question to work
Planning your next event? Share the audience, format and purpose. We’ll help shape a participation experience around the questions that matter to them.